Psychometric Assessment in Therapy: Scales, Scoring & Clinical Interpretation
Psychometric scales are widely used in therapy — but raw scores without clinical context are meaningless. In this guide, learn every dimension of psychometric assessment from scale selection to scoring interpretation, normative comparison to trend analysis, and treatment plan integration with concrete clinical examples.
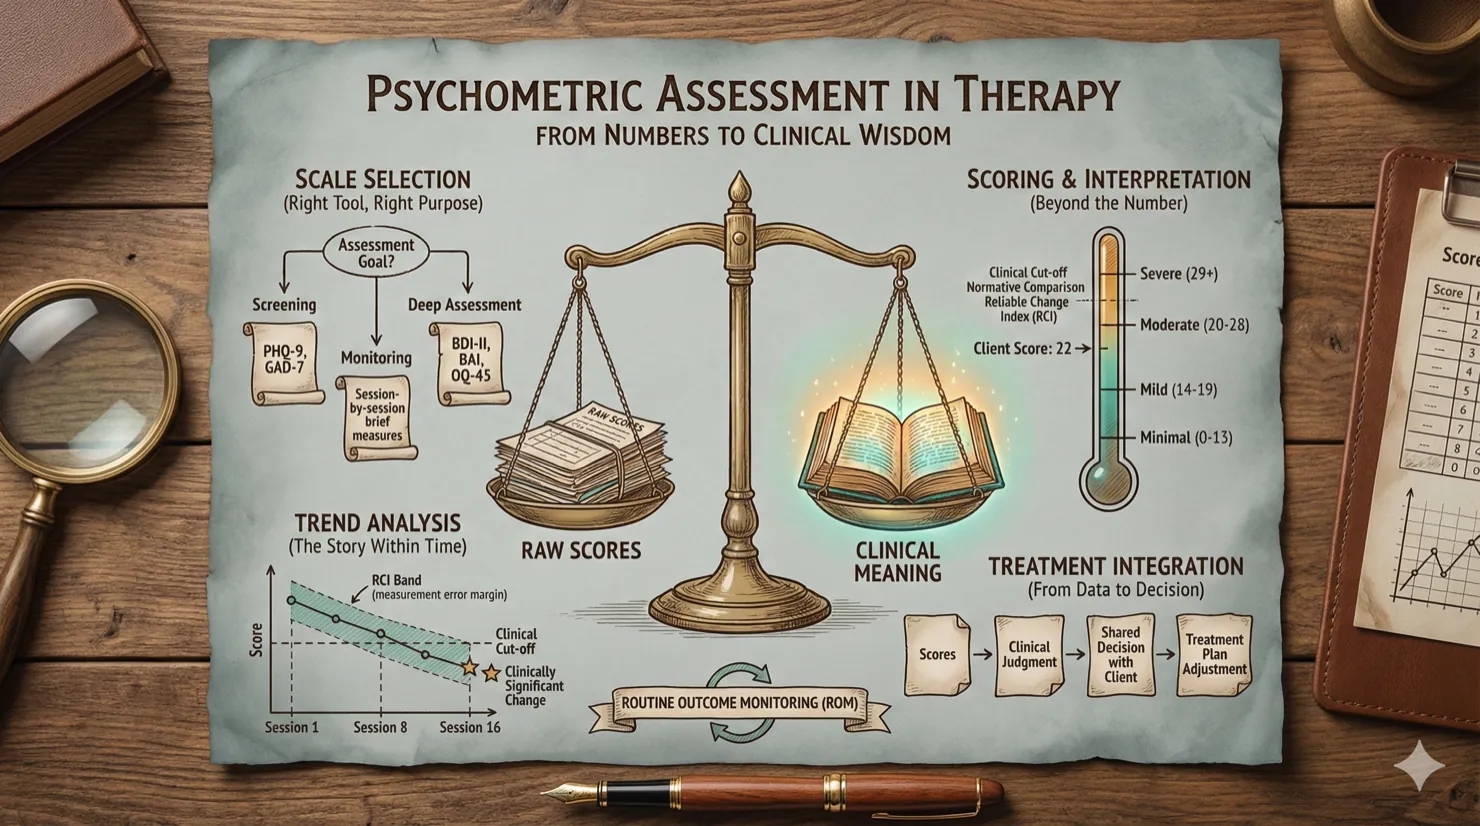
How Much Can a Number Tell?
You administered the Beck Depression Inventory (BDI-II) to Deniz and the total score came out to 22 — in the "moderate depression" range. You noted this number in their file. Now what? Is 22 an improvement compared to the 28 from three months ago? Or does this drop fall within the margin of measurement error, meaning there's no clinically meaningful change? The score says "moderate," but moderate compared to whom? A clinical population or the general population? And most importantly: what does this number mean for your treatment plan?
Psychometric assessment is one of the most frequently used yet least deeply explored tools in therapy. Many therapists administer scales, note the scores — and move on without interpretation. Raw scores are numbers devoid of context; clinical meaning emerges only with the layer of interpretation. A BDI-II score by itself is not a "depression level" — it is a standardized snapshot of a specific individual's experience, taken at a specific time, under specific conditions. And like any photograph, it cannot be interpreted without knowing the context.
In this article, we will explore the clinical depth of psychometric assessment beyond "administer and note": selecting the right scale for the right purpose, interpreting scores through clinical cutoffs and normative data, distinguishing real change from measurement error using Jacobson and Truax's (1991) Reliable Change Index, analyzing trends over time, and integrating all of this data into the treatment plan. The goal is to transform numbers into clinical wisdom.
Why "The Client Seems Better" Is Not Enough
Lambert and Ogles's (2004) comprehensive research demonstrated that therapists' clinical judgments can be seriously misleading without systematic measurement. Therapists are prone to confirmation bias when evaluating their clients' progress: a therapist expecting improvement selectively notices signs of improvement and overlooks signals of deterioration. This is not ill intent but a natural feature of human cognition — yet it poses a serious risk for clinical outcomes.
Routine Outcome Monitoring (ROM) is an approach developed to systematically correct this risk. By administering standardized scales before each session or at regular intervals, the client's progress is tracked with objective data. Studies by Lambert et al. (2001) showed that treatment outcomes improved significantly for clients of therapists who used ROM, and that clients at risk of deterioration were identified early. If a client is clinically deteriorating while the therapist thinks "we're doing well," systematic measurement is the very flashlight that illuminates this blind spot.
However, the value of ROM is not limited to "measuring" alone — the real power lies in interpreting the measurement and integrating it into treatment. Duncan's (2010) Feedback-Informed Treatment (FIT) model emphasizes sharing measurement data with the client and basing treatment decisions on this data. In this approach, psychometric assessment ceases to be a tool from which the therapist collects information "about" the client and becomes a collaborative decision-support system used "together with" the client.
Selecting the Right Scale for the Right Purpose
Scale selection is the most critical and most frequently skipped step in psychometric assessment. The reflex of "I'll measure depression, let me use the BDI-II" is understandable but insufficient. Proper scale selection is a deliberate clinical decision that considers the construct to be measured, the purpose of assessment (screening, monitoring, or outcome measurement?), and the client's characteristics (age, culture, reading level, symptom profile).
In the depression domain, the two most common scales — the Beck Depression Inventory-II (BDI-II; Beck et al., 1996) and the Patient Health Questionnaire-9 (PHQ-9; Kroenke et al., 2001) — have different strengths. The BDI-II comprehensively assesses cognitive, emotional, and somatic dimensions of depression with 21 items, while the PHQ-9 directly corresponds to DSM diagnostic criteria with its nine items and is ideal for routine monitoring with its brief administration time. In the anxiety domain, the Beck Anxiety Inventory (BAI) emphasizes somatic symptoms while the Generalized Anxiety Disorder-7 (GAD-7) better captures cognitive worry. For general functioning, the OQ-45 (Lambert et al., 1996) and CORE-OM (Evans et al., 2002) offer broad-spectrum assessment. For trauma, the PCL-5 and IES-R can be used, and for therapeutic alliance, the WAI (Working Alliance Inventory) is available.
Five core criteria should be evaluated in scale selection: validity (whether the scale actually measures the construct it intends to measure), reliability (whether it produces consistent results), sensitivity to change (capacity to capture clinical change), brevity and client burden (length that maintains the client's motivation to complete the scale), and cultural appropriateness (whether validity and reliability studies have been conducted in the relevant population). Not every scale is suitable for every purpose: the BDI-II is excellent for a comprehensive initial assessment but administering it every session may cause client fatigue; the PHQ-9 is ideal for routine monitoring but its subscale analysis is limited.
Finally, it is important to know when not to use scales. In acute crisis situations (suicide risk assessment cannot be conducted with a scale — it requires a structured clinical interview), when the client has strong resistance to scales (risk of damaging the therapeutic alliance), and when the scale lacks validity studies in the client's cultural context, scale results can be misleading. A scale is a tool — neither necessary in every situation nor sufficient on its own.
Scoring and Clinical Interpretation: The Meaning Behind the Numbers
A raw score is the numerical value summed across the scale's items — but it carries no clinical meaning on its own. Clinical meaning emerges when the raw score is related to cutoff points, severity ranges, and normative data. On the BDI-II, a score of 22 falls in the "moderate depression" range (14-19 mild, 20-28 moderate, 29-63 severe). Yet even this classification is insufficient: saying "moderate" does not tell you what constitutes a deviation from normal for this client or where the threshold for clinical intervention begins.
Normative comparison fills this gap. In the clinical population (treatment-seeking individuals), the BDI-II mean is typically in the 20-25 range, while in the general population, this mean is around 7-9. Deniz's score of 22 is close to the clinical population mean but markedly elevated compared to the general population. This distinction answers not the question "how bad is the client" but "where does the client stand relative to whom" — and it is critical for setting treatment goals.
However, the most frequently asked and most difficult question in psychometric assessment is: "Is this change real?" Jacobson and Truax's (1991) Reliable Change Index (RCI) provides a statistical answer to this question. The RCI tests whether the difference between two measurements could be due to measurement error. The formula uses the test-retest reliability and standard deviation of the scale to calculate a "reliable change threshold." For the BDI-II, this threshold is typically around 8-9 points. If Deniz's score dropped from 28 to 22, the 6-point difference falls below the RCI threshold — meaning this change may not be statistically reliable and could be due to measurement error. However, if the score dropped from 28 to 18, the 10-point difference exceeds the threshold and can be interpreted as a clinically meaningful improvement.
Subscale analysis also reveals clinical information hidden by the total score. The cognitive (guilt, worthlessness, indecisiveness) and somatic (sleep, appetite, fatigue) subscales of the BDI-II may move in different directions: the total score may remain stable while cognitive symptoms have decreased but somatic symptoms have increased. This detail is far more informative than the total score for determining the treatment focus.
Trend Analysis: The Story Within Time
A single measurement is a photograph; repeated measurements are a film. The most powerful dimension of psychometric assessment is making the dynamics of the treatment process visible by tracking how scores change over time. However, trends do not always follow a straight line — clinical reality is far more complex than a linear improvement model.
Research has identified several fundamental response patterns. Early response, seen in clients who show marked score decreases in the first few sessions of treatment, is associated with good long-term prognosis. Gradual improvement, progressing in small but consistent steps with each measurement, is the most commonly observed pattern. Sudden gains, as defined by Tang and DeRubeis (1999), manifest as large and sustainable score decreases between two consecutive sessions — typically reflecting a critical cognitive shift. Deterioration, where scores increase during the treatment process, requires immediate clinical attention.
Interpreting non-linear trajectories requires clinical expertise. A client's scores drop rapidly in the first four sessions, then plateau — is this "stalling of improvement" or "reaching a sustainable level"? Another client's scores occasionally spike before dropping — this "fluctuating course" may actually reflect temporary worsening during periods when challenging therapeutic material is being processed, followed by consolidation. Trend analysis is indispensable for recognizing these patterns and determining the appropriate clinical response for each.
Visualizing progress — displaying scores on a graph — is a powerful tool for both therapist and client. While the client subjectively feels "I'm not getting any better," a graph showing their BDI-II score dropping from 28 to 16 provides concrete and undeniable evidence. This visualization strengthens the therapeutic alliance, increases motivation, and enables the client to take ownership of their own progress.
Treatment Plan Integration: From Data to Decision
The clinical value of psychometric data is realized only when it is translated into treatment decisions. The first step of this integration is relating measurement data to treatment goals. If Deniz's BDI-II score is 22 and the treatment goal is "to reduce depressive symptoms below the mild level," the target score is below 13 — and the distance between the current score and the target makes concrete where the treatment stands.
However, a critical clinical paradox comes into play here: scores may improve while the client doesn't feel better, or the client may feel much better while scores remain stable. The first situation indicates that the symptom reduction captured by the scale has not yet translated into subjective well-being — that is, change has occurred at the cognitive level but is not yet felt at the emotional level. The second situation suggests either the client's tendency to overestimate improvement in a specific area, or that the scale may not fully capture the client's experience. In both cases, the correct response is to share the data with the client and make meaning of it together.
To systematize this integration, sharing measurement data with the client each session is essential. A question like "Your score dropped 4 points compared to last session — does that surprise you?" carries the data into the therapeutic relationship and enables a transition from a one-sided process where scores are analyzed about the client, to a collaborative process where meaning is made together with the client.
Intervention adjustment should also be data-driven. If scores are not decreasing or a deterioration trend is emerging, three possibilities should be evaluated: is the intervention appropriate but at an insufficient dose (should session frequency or intensity be increased?), is the intervention not suited to this client's needs (is a change in approach needed?), or is there a problem in the therapeutic alliance? Research by Lambert et al. (2001) has shown that data-driven intervention adjustment improves outcomes particularly for clients who are not responding to treatment.
Filled Example: Deniz, 25, Depression + Anxiety
The following two examples show records structured with Mindora's psychometric assessment templates. The first example shows a BDI-II record with the Standard Scale Result template, and the second shows a trend analysis over four measurements with the Scale Comparison and Trend Analysis template.
Standard Scale Result (BDI-II, Session 1)
Scale Name: Beck Depression Inventory-II (BDI-II)
Assessment Date: Initial assessment (Session 1)
Scale Category: Depression (PHQ-9, BDI-II, HAM-D)
Total Score: 28/63
Subscale Scores: Cognitive subscale (guilt, worthlessness, indecisiveness): 14/27 — Somatic subscale (sleep, appetite, fatigue): 14/36. Cognitive and somatic symptoms are equally weighted.
Clinical Severity Level: Moderate (20-28 range)
Clinical Interpretation: The client shows moderate depressive symptoms. In the cognitive domain, worthlessness (item 14: 3/3) and indecisiveness (item 13: 2/3) are prominent. In the somatic domain, sleep disturbance (item 16: 3/3) and fatigue (item 20: 2/3) are notable. The suicidal ideation item (item 9) is 0/3, indicating low risk.
Comparison with Previous Measurement: First measurement — recorded as reference baseline.
Scale Comparison and Trend Analysis (BDI-II, 4 Measurements)
Scale Name: Beck Depression Inventory-II (BDI-II)
Session 4 (month 1): 24
Current Measurement: Session 12 — Score: 15/63
Overall Change Amount: 8/10 (significant improvement direction)
Trend Pattern: Gradual improvement — slow decline in first four weeks (28 to 24), notable decline in second month (24 to 19), sustainable improvement in third month (19 to 15). Severe to Moderate to Mild transition completed.
Trend Interpretation: The total decline of 13 points exceeds the Reliable Change Index threshold for the BDI-II (approximately 9 points) — the change is clinically meaningful. The slow response in the first month corresponds with the therapeutic alliance building period. The notable decline in the second month is temporally consistent with the initiation of cognitive restructuring work. Improvement in the cognitive subscale (14 to 6) is more pronounced than in the somatic subscale (14 to 9) — focusing on somatic symptoms may be beneficial.
5 Principles of Effective Psychometric Assessment
Measure What Matters for This Client, Not Everything
Administering the same battery of scales to every client both increases client burden and blurs the clinical focus. Scale selection should stem from the case formulation: in a case where the primary problem is depression, the BDI-II or PHQ-9 takes priority; in an anxiety-dominant case, the GAD-7; in trauma-focused work, the PCL-5. At most two to three core scales per client is sufficient — more produces noise, not signal.
Establish a Baseline Before Treatment Begins
Without a baseline measurement, evaluating progress is impossible. Administering core scales in the first session — preferably before starting the intervention — establishes the reference point for the treatment process. Without this reference, the statement "the client has improved" cannot go beyond a subjective impression. A baseline measurement also makes treatment goals concrete: "reduce the BDI-II score from 28 to below 13" is a measurable goal.
Use Scores Alongside Clinical Judgment, Never Scores Alone
Scales do not replace clinical judgment; they support it. A client's BDI-II score may have dropped to 10, but the emotional flattening and loss of motivation observed in session may reflect a clinical picture the score cannot capture. Conversely, scores may come out high while the client is performing much better functionally. When score and clinical observation are discrepant, an integrated assessment that considers both should be conducted — ignoring one in favor of the other is an error.
Share Results Collaboratively with the Client
Psychometric data belongs to the client — and it creates the most powerful impact when shared with them. A question like "Your score dropped 6 points compared to last month — does that surprise you?" makes the client an active evaluator of their own progress. When scores live within the therapeutic dialogue rather than in the therapist's confidential file, they both increase motivation and place treatment decisions on a collaborative foundation.
Measure at Consistent Intervals
Measurements taken at irregular intervals prevent reliable trend analysis. Ideally, measurements should be taken at fixed intervals (every four sessions, or monthly). This consistency makes change over time comparable and enables early detection of important patterns such as sudden gains or deterioration. The measurement schedule should be established at the start of treatment and shared with the client.
Common Mistakes
Administering Scales Without Interpreting Them
The most common mistake is using scales with an "I administered it, filed it away" reflex. A raw score without clinical interpretation is just a number. If a BDI-II score has been noted but not compared with cutoff points, the difference from the previous measurement has not been analyzed, and it has not been connected to the treatment plan, the scale has not produced clinical value — only an administrative form has been filled out. Every measurement should contain at least one sentence of clinical interpretation: "Score 22, moderate level, 6-point drop from previous measurement is below the RCI threshold, increase in somatic subscale is noteworthy."
Using Scales as Diagnostic Tools
Scoring 15 on the PHQ-9 is not sufficient to make a "major depression diagnosis." Psychometric scales are screening and monitoring tools, not diagnostic tools. Diagnosis is a multidimensional process requiring structured clinical interview, history-taking, differential diagnosis, and clinical judgment. Scale scores provide data for this process but are not the process itself. The statement "depression score is high on the PHQ-9" is clinically correct; the statement "major depression according to the PHQ-9" is methodologically flawed.
Ignoring Subscale Patterns
The total score can mask changes moving in different directions across subscales. A client's BDI-II total score may have remained stable at 22 between two measurements — but cognitive symptoms may have dropped from 14 to 8 while somatic symptoms rose from 8 to 14. Saying "no change" based on the total score is clinically highly misleading. Subscale analysis reveals which dimensions the treatment is effective in and which areas need to be targeted.
Not Accounting for Response Bias and Social Desirability
Clients do not always complete scales with full honesty — this is not deliberate deception but is mostly an unconscious tendency. Some clients underreport their symptoms (minimization), some exaggerate, and some respond in the direction of improvement to please the therapist (social desirability). When there is a discrepancy between score and clinical observation, it is important to evaluate the possibility of response bias and, when necessary, address this topic with the client in an open and non-judgmental manner.
Psychometric Assessment with Mindora
Mindora's Psychometric Assessment note type is designed to transform the scale recording, trend analysis, and clinical interpretation processes discussed in this article into a structured workflow. It offers three templates:
Standard Scale Result (Default): With its four-section structure, it includes scale information (scale name, administration date, scale category checklist), scores (total score, subscale scores, clinical severity level checklist), clinical interpretation (therapist interpretation and comparison with previous measurement), and treatment plan connection (related goals, interventions, next measurement plan). It structurally supports the "score + interpretation + treatment connection" integrity emphasized in this article.
Scale Comparison and Trend Analysis: With its three-section structure, it includes measurement history (scale name, past measurements, and current measurement), trend analysis (overall change amount scale, trend pattern, and trend interpretation), and clinical implications (target score and progress, treatment plan revision, next steps checklist). The second record of the Deniz case in our filled example was structured with this template.
Scale Interpretation and Clinical Implications: With its three-section structure, it includes scale result (interpreted scale and basic score information), clinical interpretation and implications (detailed clinical interpretation, case formulation connection, related themes and symptoms), and intervention and goal recommendations (priority intervention areas, goal recommendations, treatment plan recommendations). It is the most comprehensive interpretation template supporting the "from data to decision" process emphasized in this article.
Psychometric assessment notes created with any of the three templates can be linked to treatment plan, session note, and case formulation notes through Mindora's Knowledge Network feature — so measurement data does not remain as isolated numbers but is integrated with the entirety of the treatment process.
References
- Lambert, M. J. & Ogles, B. M. (2004). The efficacy and effectiveness of psychotherapy. In M. J. Lambert (Ed.), Bergin and Garfield's Handbook of Psychotherapy and Behavior Change (5th ed., pp. 139–193). Wiley.
- Jacobson, N. S. & Truax, P. (1991). Clinical significance: A statistical approach to defining meaningful change in psychotherapy research. Journal of Consulting and Clinical Psychology, 59(1), 12–19.
- Tang, T. Z. & DeRubeis, R. J. (1999). Sudden gains and critical sessions in cognitive-behavioral therapy for depression. Journal of Consulting and Clinical Psychology, 67(6), 894–904.
- Duncan, B. L. (2010). On Becoming a Better Therapist: Evidence-Based Practice One Client at a Time. American Psychological Association.
- Beck, A. T., Steer, R. A. & Brown, G. K. (1996). Manual for the Beck Depression Inventory-II. Psychological Corporation.
- Kroenke, K., Spitzer, R. L. & Williams, J. B. (2001). The PHQ-9: Validity of a brief depression severity measure. Journal of General Internal Medicine, 16(9), 606–613.
- Evans, C., Connell, J., Barkham, M., Margison, F., McGrath, G., Mellor-Clark, J. & Audin, K. (2002). Towards a standardised brief outcome measure: Psychometric properties and utility of the CORE-OM. British Journal of Psychiatry, 180(1), 51–60.
- Lambert, M. J., Whipple, J. L., Smart, D. W., Vermeersch, D. A., Nielsen, S. L. & Hawkins, E. J. (2001). The effects of providing therapists with feedback on patient progress during psychotherapy. Psychotherapy Research, 11(1), 49–68.
This Article Is Part of the Clinical Assessment Series
This article is one of the deep-dive posts in the clinical assessment series. You can access all posts in the series below.
Initial Assessment & Anamnesis: A Therapist's Comprehensive Guide
Learn biopsychosocial assessment, structured interviewing, mental status examination, and risk screening with concrete clinical examples and practical principles.
Problem & Symptom Analysis: ABC, SORKC and Behavioral Chain Analysis Guide
Compare ABC, SORKC, and Behavioral Chain Analysis frameworks. Learn when to use each method with filled clinical examples and practical documentation principles.
Symptom Clusters & Diagnostic Patterns: Connecting the Dots
Learn transdiagnostic symptom grouping, severity and frequency measurement, temporal pattern analysis, and longitudinal tracking with concrete clinical examples.
Comprehensive Clinical Assessment: Integrating All Four Pillars
Learn to integrate initial assessment, symptom analysis, symptom clusters, and psychometric data into a unified clinical picture that bridges assessment to formulation.